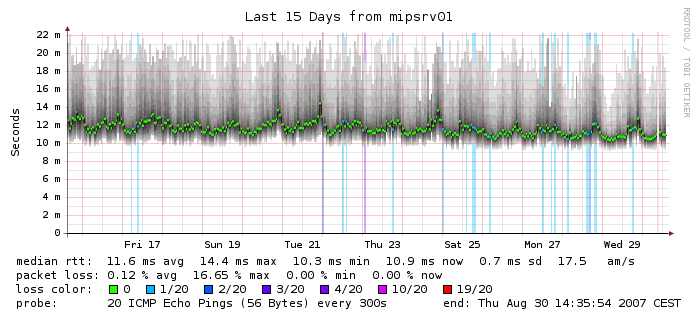
Smokeping is an open source tool that pings (with traditional icmp or more advanced tools) an IP multiple times per polling interval and keeps track of the response time. Then when you bring up the web interface to see statistics it shows super useful information like average latency, jitter (difference between high and low latency), etc. and displays in a very neat looking graph showing average and "smoke" showing responses that fell outside the average. Let's see if I can get an image to use as an example:
Image may be NSFW.
Clik here to view.
In this example it's set to send 20 small pings every 300 seconds. The green dots are each interval where all 20 pings were successful. The colored dots and vertical lines indicate some portion of loss witnessed. The grey areas above and below the averages is the variation in round trip time between each of the 20 pings.
I use a 10-ping-every-60-second method to get more detail but it's all configurable.
Is there a way in NPM to get some results similar to this and if not, is there a way to at least get more aggressive pinging and reporting on latency fluctuations and jitter between Orion and any IP destination (not using IPSLA)?
Thanks for reading.
Eric
