We have a scheduled network discovery configured and the results show up on the Solarwinds console as expected. Is there a way to email the results out from each scan if new devices are detected? I don't see any options on there at the moment.
↧
Network Discovery Email
↧
NPM 12.3 upgrade issues
Morning/afternoon.
I was planning to do all of our app upgrades tomorrow, but with every large update, it takes considerably a length of time to resolve the issues after said upgrade.
Has anyone done the upgrade yet and had any issues after?
↧
↧
It is possible to make this report concentrated by Month.
It is possible to make this report concentrated by Month.

↧
Node Downtime with Duration and Minimum Length Filtering
**REQUIRES ORION PLATFORM 2018.2 OR ABOVE**
I had assembled this based on a much older SQL report, and then updated it to SWQL, then added some more intelligence to it so you can filter it based on the duration of the outage, search by the device names, and it has a method of letting you know when nodes have been down so long they aged out of the events table.
Based on popular requests I figured it was time to put it out here to make it easier for the Thwackers to find and use. This is intended to be used inside the Custom Query Resource

select n.caption as [Device]
-- shows the current status icon
, '/Orion/images/StatusIcons/Small-' + n.StatusIcon AS [_IconFor_Device]
-- makes a clickable link to the node details
, n.DetailsUrl as [_linkfor_Device]
-- shows the timestamp of the down event, if there is no timestamp then is says the event was greater than the number of days in your event retention settings
, isnull(tostring(t2.[Down Event]),concat('Greater than ',(SELECT CurrentValue FROM Orion.Settings where settingid='SWNetPerfMon-Settings-Retain Events'),' days ago')) as [Down Event]
-- shows the timestamp of the up event, unless the object is still down
, isnull(tostring(t2.[Up Event]),'Still Down') as [Up Event]
-- figures out the minutes between the down and up events, if the object is still down it counts from the down event to now, displays 99999 if we cannot accurately determine the original downtime, and
, isnull(MINUTEDIFF(t2.[Down Event], isnull(t2.[Up Event],GETUTCDATE())),99999) as Minutes


from orion.nodes n
left join (SELECT
 -- Device nodeid used for our join
 StartTime.Nodes.NodeID

 -- Down Event time stamp in local time zone
 ,ToLocal(StartTime.EventTime) AS [Down Event]
 -- Up Event time stamp in local time zone
 ,(SELECT TOP 1
 ToLocal(EventTime) AS [EventTime]
 FROM Orion.Events AS [EndTime]
-- picks the first up event that is newer than the down event for this node
 WHERE EndTime.EventTime >= StartTime.EventTime
-- EventType 5 is a node up
 AND EndTime.EventType = 5
 AND EndTime.NetObjectID = StartTime.NetObjectID
 AND EventTime IS NOT NULL
 ORDER BY EndTime.EventTime
 ) AS [Up Event]
-- This is the table we are querying
FROM Orion.Events StartTime
-- EventType 1 is a node down
WHERE StartTime.EventType = 1
) t2 on n.NodeID = t2.nodeid


-- this is how I catch nodes that are down but have aged out of the events table
where (n.status = 2 or t2.nodeid is not null)


-- If you want to filter the results to only show outages of a minimum duration uncomment the below line
--and MINUTEDIFF(isnull(t2.[Down Event],(GETUTCDATE()-30)), isnull(t2.[Up Event],GETUTCDATE())) >  60


-- if you want to use this query in a search box of the Custom Query resource uncomment the below line
--and n.Caption like '%${SEARCH_STRING}%'


order by t2.[down event] desc
Loop1 Systems: SolarWinds Training and Professional Services
- LinkedIN: Loop1 Systems
- Facebook: Loop1 Systems
- Twitter: @Loop1Systems
↧
Help to create the Community string failed report?
Hi, As I checked, community string test being failed for few nodes but Node's Icon is in green state (UP state). Help to create the Community string failed report.
↧
↧
Do You use Product Upgrade Advisor website before you upgrade product?
SolarWinds has Product Upgrade Advisor website which helps users to validate compatibility of product versions.https://customerportal.solarwinds.com/support/product-upgrade-advisor
Do you use that prior any product upgrade?
↧
report schedule each minute
Hi,
I´m looking for desperately any way to schedule a report with report Scheduler each minute.
Is there any hack to get this ?
↧
How much bytes does it takes to monitor a node?
Hi,
I tried this question with support and have not got a response yet... don't be confused with the question how many bytes it takes to get to the center of Solarwinds
My current issue is that I am running out of SQL disk space, and with the upgrade of NTA using the same SQL server, I need to plan for additional resources, plus plan/forecast growth for the next 5 years.
Question, on average, how much disk space in bytes or Mb does it cost to monitor a single node. Ball park number is good as well, since I know it varies from alerts to poll, etc. Maybe just a default number? 1mb, 2mb?
Thank you in advance.
↧
Unable to edit node via node management
Hi All,
We are getting website error while trying to edit node via node management.
Support provided following steps to resolve the issue. No one is picking the call either...
Can someone help me on this.
Case # - 00137584 Unable to edit node via node management
Steps performed :
Go to database manager > expand the instance of the solarwinds database > right click new query > and run the query below.
DELETE FROM PendingNotifications
DELETE FROM Subscriptions
DELETE FROM SubscriptionTag
↧
↧
Change the status icon when a device has a problem (Exported Alert)
(Original blog post: Exported Alert: Change The SolarWinds Status Icon When A Device Has A Problem | Prosperon Networks )
Hi Thwackers
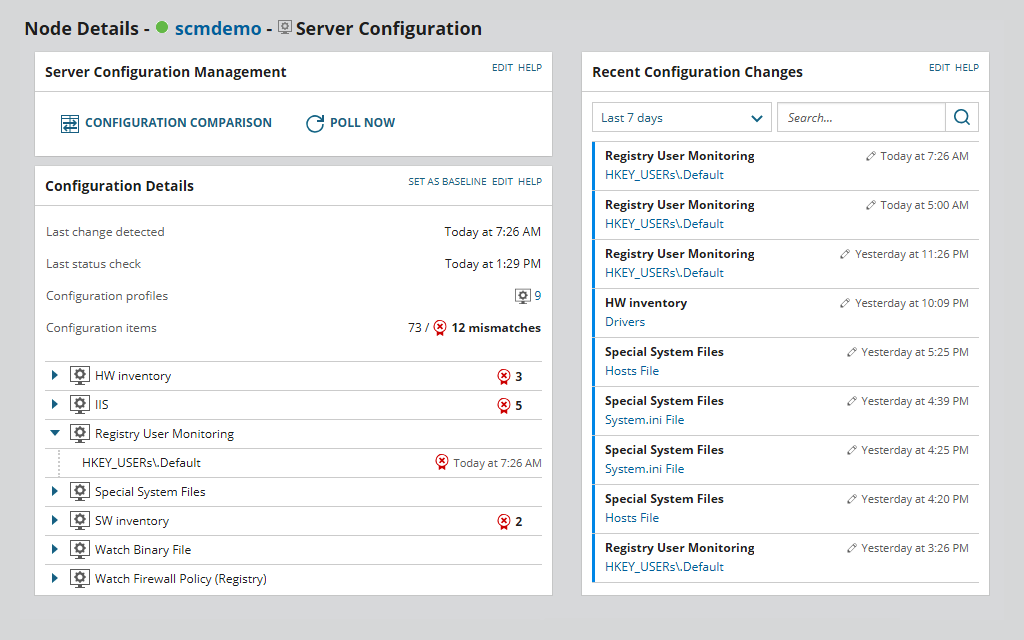
A common complaint that I receive when I’m onsite delivering consultancy or training on SolarWinds is that alerts can be disconnected from what you see for the device status on the web interface. I understand that this is quite annoying when you check a device and you see its status is green when the same device has a critical alert.
SolarWinds was aware of that, hence, they added a feature into the Orion alerting engine that allows us to customise the status of the device using alert actions. On any alert, you can add the trigger action to change the status to something customised. Just to give you a little bit more background into how this works, by default, the up/down status of a device depends on the polling method (normally ICMP ping). If the device replies to the ping from the SolarWinds server, it will display the green icon (up), if not, it will display the red icon (down).
When this new feature was released, SolarWinds added two more possible statuses: critical and warning. To be honest, the warning status has been available for a while. This status is used when a device misses the first ping and starts the warning level. During a validation period, the device stays in warning status until it starts replying to ping or after two minutes when the status changes to down. Critical status though was completely brand new.
Even though I loved this idea, I found it was not so easy to use. To explain myself better, let me use this example:
- Node ‘A’ triggers an alert that changes the status to ‘critical’.
- Sometime later, Node A triggers another alert that changes the status to warning.
Now we have Node A with two active alerts; one critical, and one warning, but the status of node A is warning because the last alert overwrote the status from critical to warning.And this could be even worse, imagine that when the second alert (the warning) is cleared, and this clears the warning status, reverting its status to the normal polled status, i.e. up status. Therefore, we would have Node A with a critical alert showing as status is up.
The Solution
The solution I came up with is to create a brand-new alert that will be triggered if a device has one or more active alerts, changing the status to whatever custom status we want. This alert will be reset when there are no active alerts, assigning the polled status to the node. This way we make sure that the status is not overwritten when it shouldn’t be. Basing this on alerts that are already active on a device also means we can be more intelligent about the appropriate status applied to the device.The way I’ve configured these alerts is:
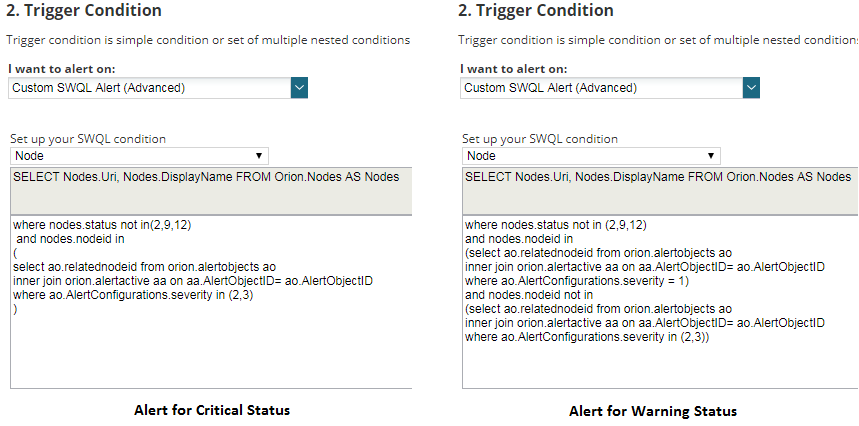
- Alert 1: Change status to critical if a node that is not down, unmanaged or unreachable has at least one critical or serious alert.
- Alert 2: Change status to warning if a node that is not down, unmanaged or unreachable has at least one warning alert but no critical or serious alert.
If you agree with me, good news! I’ve created these alerts and made them available below. To be honest these alerts are not too difficult to create:
- Trigger conditions: I’ve used SWQL for nodes, which is a little more advanced but brings great power and control.
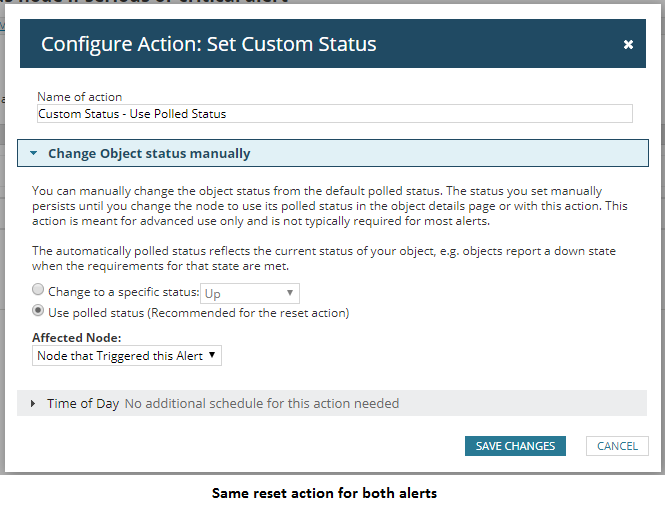
- Reset conditions: when trigger conditions are no longer true.
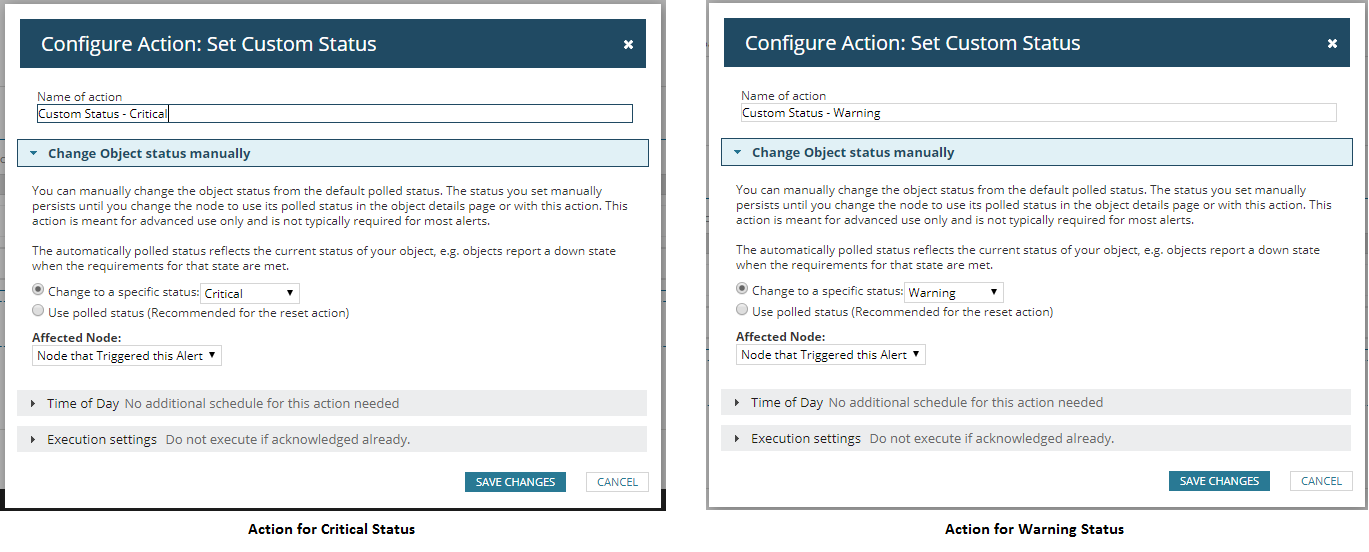
- Trigger action: changes the status to the chosen status (warning or critical).
- Reset action: changes the status to the polled status (probably up).
NOTE: You might have a different idea on when to assign a custom status, so feel free to modify the scripts, but hopefully this has got your creative juices flowing.
I hope these alerts help you guys get a clearer understanding of which devices are having problems and which ones are ok.
Raul Gonzalez
Prosperon - UK SolarWinds Partners
Installation | Consultancy | Training | Licenses
↧
Agent Issue
Hi,
Can anyone tell me about this Agent Icon? How to fix it?

I referred below url but no luck.
http://www.solarwinds.com/documentation/en/flarehelp/npm/content/core-status-indicators-sw2111.htm
Apart from this Agent status is good on below node but still getting an error: Its frequently happening


↧
What We're Working on for NPM (Updated June 1st, 2018)
NPM 12.3 has shipped and we're hard at work building the next release. Here's what we're working on, in no particularly order.
- Cisco ACI Monitoring
- Remote Collector - New, agent based collector for distributed environments and hybrid deployments
- Next Generation Orion Mapping - First version delivered in NPM 12.3 via Orion Platform 2018.2. Working on the next version.
- Centralized Upgrades
- Website & Database Performance Improvements
- Windows Device Guard Support
- SAML Authentication Support
- Replace syslog/trap with the functionality from our new Log Manager product
↧
Help to create " Solarwinds Windows Server Event log" Dashboard for error logs:
Hi,
I am looking for " Solarwinds Windows Server Event log" Dashboard for error logs:


↧
↧
Automating a Node to Unmanaged
I was looking at possible way to take a network device that has been offline for 45 days and have it change to Unmanaged. We have equipment that gets turned off, but not picked up from the site, so the network team does not want it removed from SW until it has been retrieved and checked back in.
Any Ideas?
Thanks,
↧
APE Error while editing Nodes Properties -The formatter threw an exception while trying to deserialize the message: There was an error while trying to deserialize parameter http://schemas.solarwinds.com/2008/Core:GetNodesByIdsResult. The InnerException me
Hi team,
Need your help with the below mentioned error. It is popping up when editing nodes of Additional Poller.
The formatter threw an exception while trying to deserialize the message: There was an error while trying to deserialize parameter http://schemas.solarwinds.com/2008/Core:GetNodesByIdsResult. The InnerException message was 'Member '_compareInfo' was not found.'. Please see InnerException for more details
↧
How do I create a Microsoft Excel spreadsheet from a device to track its up and down event times?
How do I create a Microsoft Excel spreadsheet from a device to track its up and down event times?
This would be under “Events,” and filter device objects would be “Network Object”, “Type of Device,” “Event Type,” and “Time Period.” These would be the columns that I would create in Exel and are found under Events. Events is found under Alerts & Activity. I only see that one can export this as a PDF file but not an Excel spreadsheet. Does anyone have any suggestions or need more information? Please. Thank you and have a great day.
↧
What is the #1 networking problem you need to solve in the next 30 days?
Please expand on “Other” and why by adding a comment below.
↧
↧
WMI not reading disk volume data
Hello,
I have NPM setup and working for a few nodes. I am using WMI to monitor my Windows server. Most of them are able to report disk drive data and some are not. Does anyone have any idea why Solarwinds NPM can read drive data for one server and not others?
↧
NPM ping snmp report monitor
We're monitoring about 100 devices some with ping and mostly snmp. Do you know of a way to pull a report on which ones are ping monitoring vs snmp monitoring? Going to take me a long time if I have to click on each to check then capture it.
Thank you,
Ted
↧
Correct MIB definition for HP VC FlexFabric 10Gb/24-Port Module
I setup in NPM a VC FlexFabric 10Gb/24-Port Module to monitor. However, it does show up a large part of the information but the transmit/receive stats are very low. I am wondering if the correct MIB definition is being used. The HP part number is 571956-B21.
Thanks,
Tom
↧